QuanTP: A Software Resource for Quantitative Proteo-Transcriptomic Comparative Data Analysis and Informatics
Praveen Kumar †‡▽, Priyabrata Panigrahi §▽, James Johnson ∥∥, Wanda J. Weber ⊥, Subina Mehta ‡, Ray Sajulga ‡, Caleb Easterly ‡, Brian A. Crooker ⊥, Mohammad Heydarian #, Krishanpal Anamika *§, Timothy J. Griffin ‡, and Pratik D. Jagtap*‡
† Bioinformatics and Computational Biology Program, University of Minnesota- Rochester, Rochester, Minnesota 55904, United States
‡ Department of Biochemistry, Molecular Biology, and Biophysics, University of Minnesota, Minneapolis, Minnesota 55455, United States
§ LABS, Persistent Systems, Aryabhata-Pingala, Erandwane, Pune 411004, India
∥∥ Minnesota Supercomputing Institute, University of Minnesota, Minneapolis, Minnesota 55455, United States
⊥ Department of Animal Science, University of Minnesota, St. Paul, Minnesota 55108, United States
# Department of Biology, Johns Hopkins University, Baltimore, Maryland 21218, United States
▽ these authors contributed equally to this work
*Corresponding author(s):
Pratik Jagtap and Krishanpal Anamika
Email: pjagtap@umn.edu and anamika_krishanpal@persistent.com
Phone: +1 612 624 0381 and +91 (20) 6703 3000
Original “Supporting Information” Document
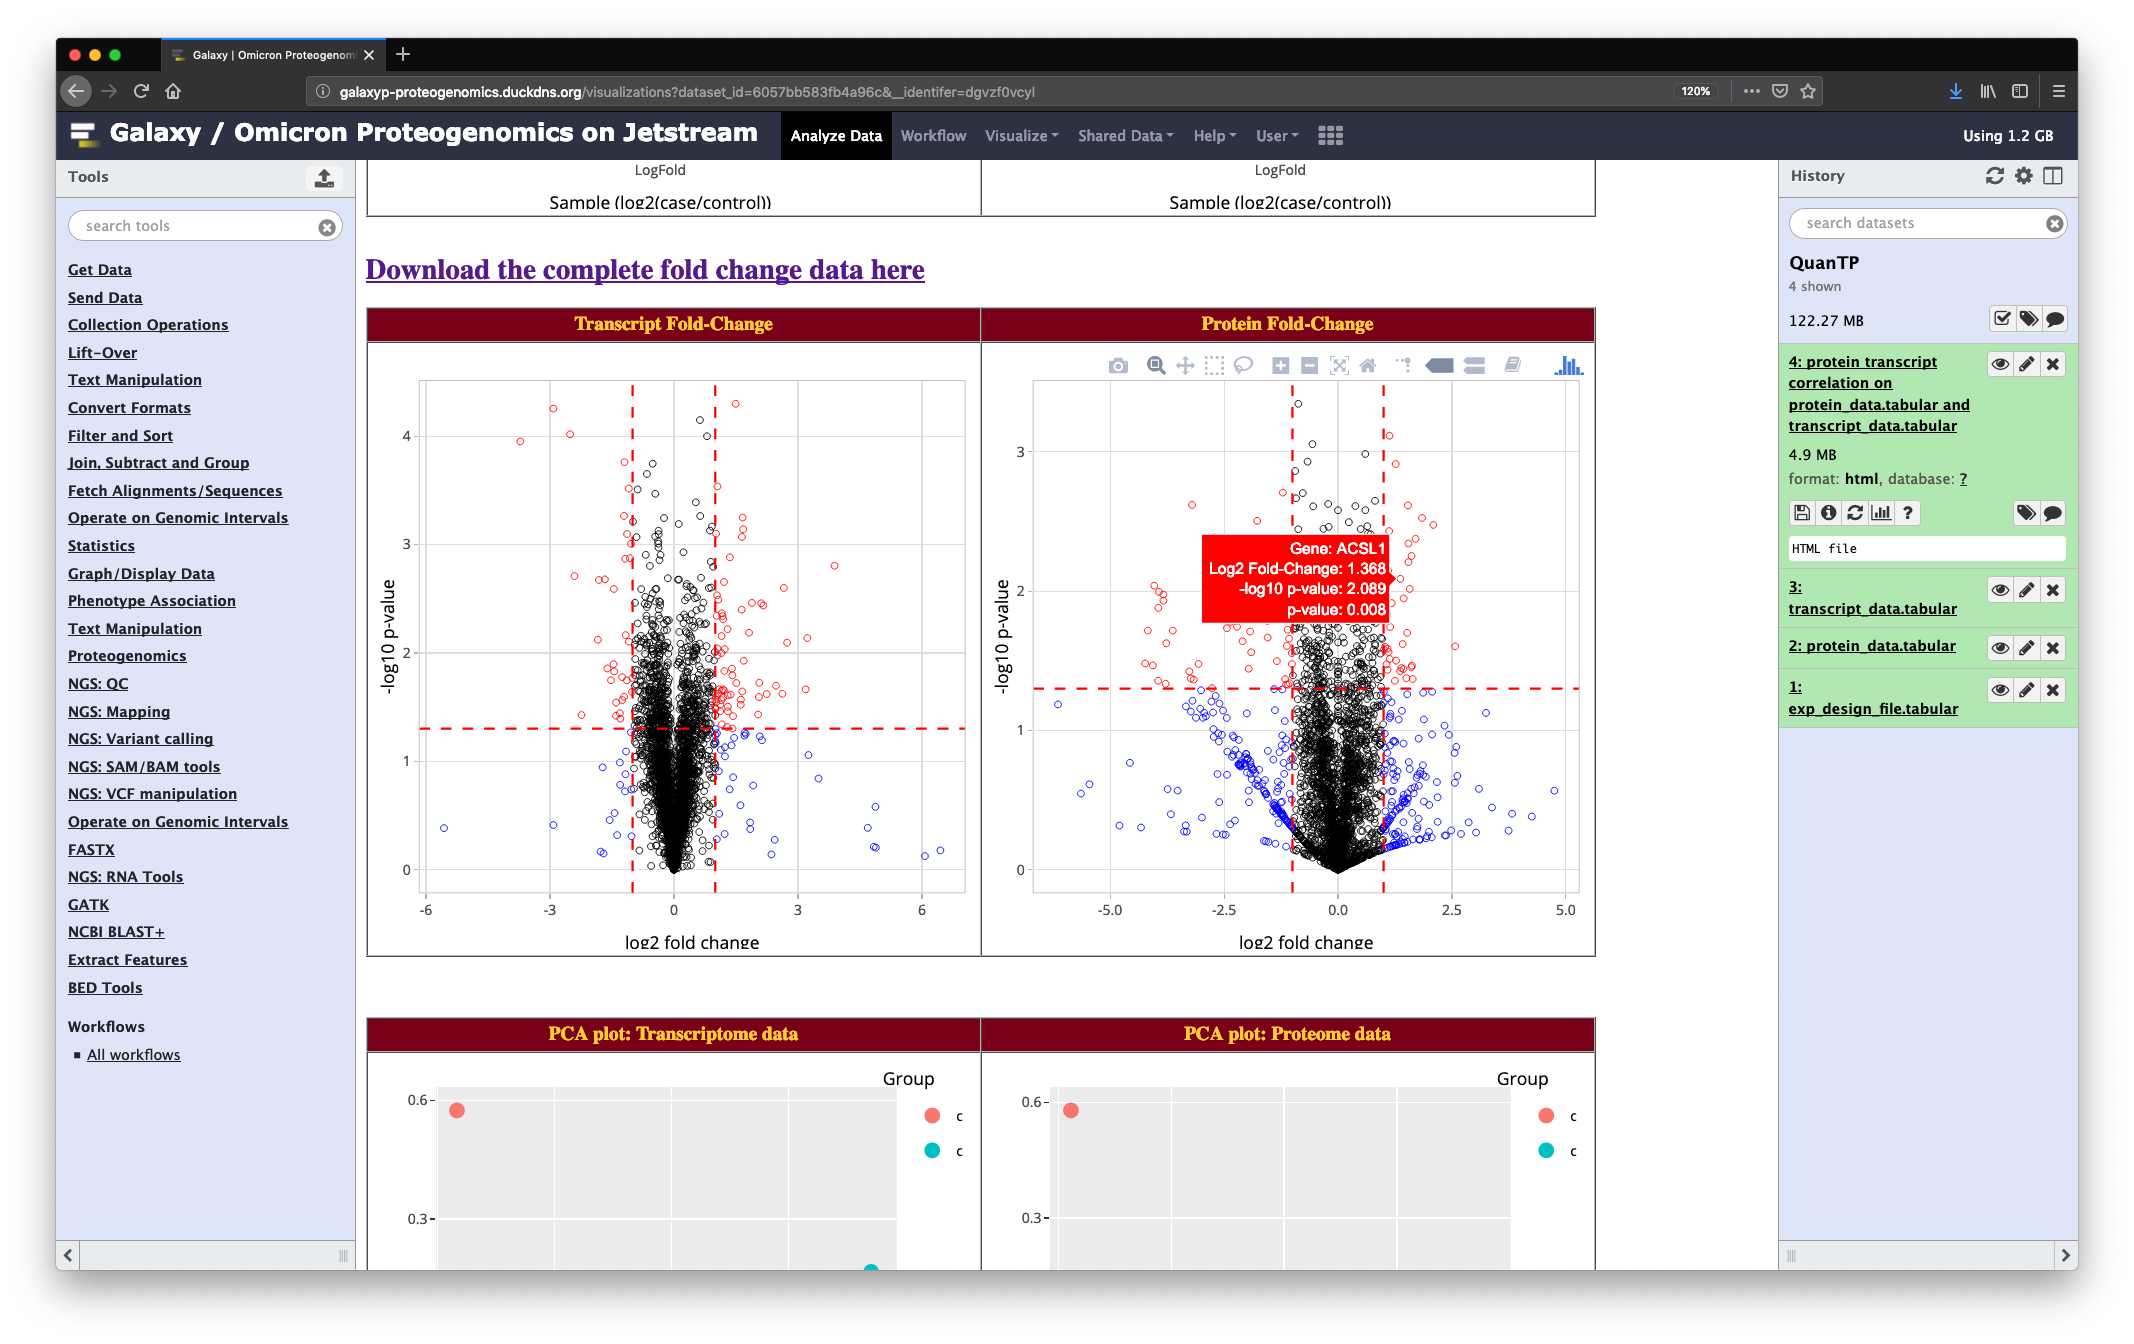
Newest Update: Interactive plots for QuanTP (versions ≥ 1.1.0)
2.21.19 - All plots can now be viewed via Plotly for interactivity! Instructions for enabling this are here.
Features:
- Zooming and panning
- Export plots in png format
- Mousing over points to view more details and compare them with one another
S1: Instructions for accessing the QuanTP tool on Jetstream
- Go to z.umn.edu/proteogenomicsgateway. This is a public Galaxy gateway hosted on the Jetstream (https://jetstream-cloud.org/), a cloud-based resource for scientific computing and research.
- The Galaxy Jetstream instance requires that all users input an email address to access
tools and workflows. To register, perform the following steps:
- Click on the “Login or Register” tab and click on “Register”. Enter an email address, password and public name of choosing. [ NOTE: Users choosing to remain anonymous can enter an email in the form of “guest@galaxyp.org”, along with a password and public name of your choosing. Also note that this instance is solely for training purposes, and not for long-term use or testing with large datasets.]
- Once registered, click on the “User” tab and click on “Login” with your user credentials.
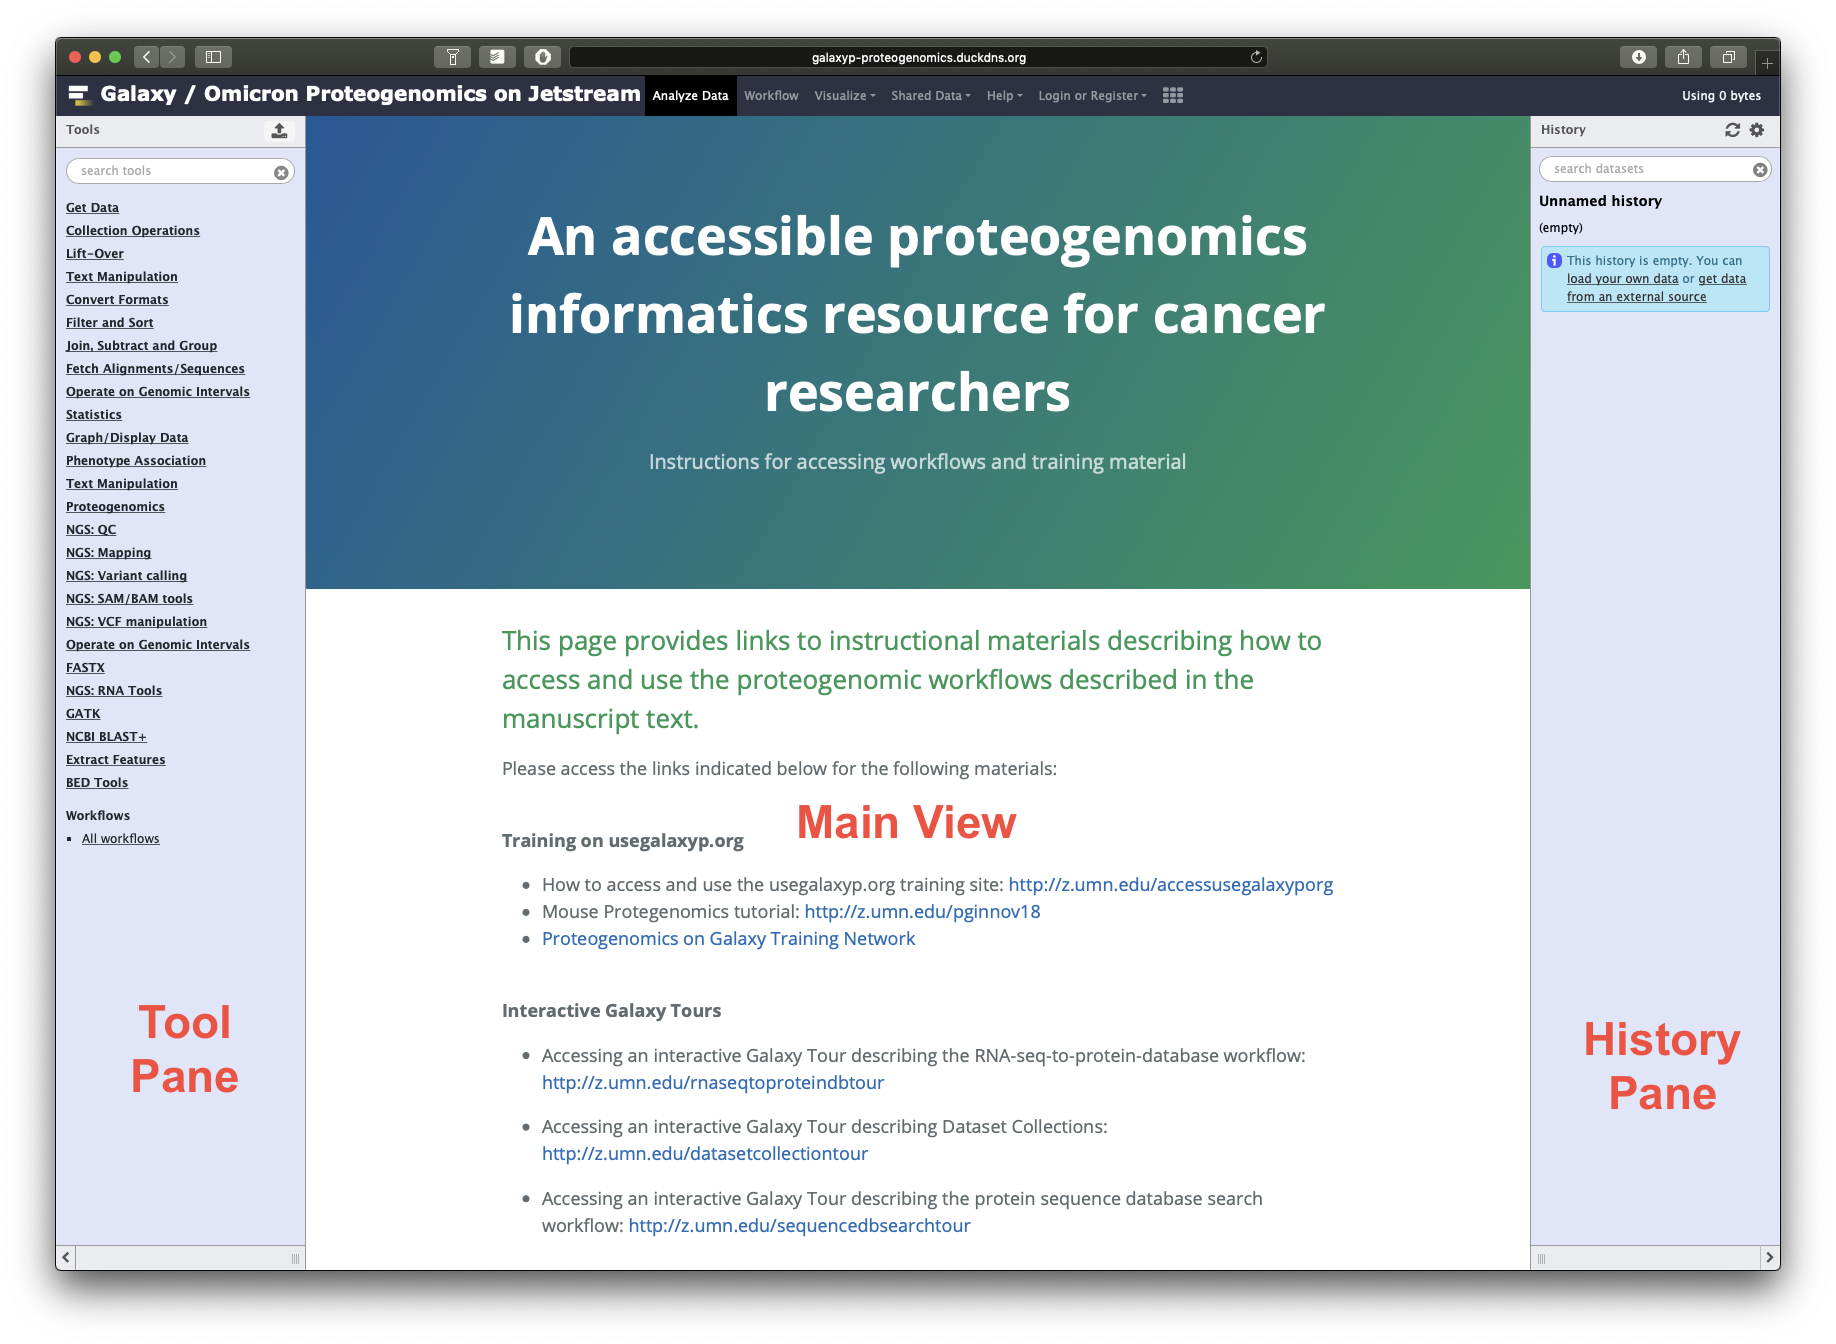
- The Galaxy interface is divided into three panels: a Tool pane on the left side of the
interface, a Main viewing pane in the center and a History pane to the right. The Tool pane
consists of organized list of software tools available to users in a particular Galaxy
instance. The Main view displays the information regarding the tool, input/output from
the tool, workflow editing space, etc. The History pane contains an ordered list of datasets
that were uploaded and generated as outputs from tools used for analysis. The active
history is shown in the History Pane of the user interface.
- The first step for the analysis is to import the required input datafiles. For running any
workflow, appropriate inputs that the tools requires is critical. To access the inputs for
this demonstration, we have provided two input data libraries (bovine dataset and mouse
dataset). Let’s begin the initial testing with the bovine dataset, click on “Shared Data”→
“Data libraries”→ “QuanTP Inputs”→ “QuanTP_cow_input ”, select all files in the folder.
Then, click on
 to import all the input files. The input file consists of protein,
transcript abundance data and an experimental design file, all in tabular format.
to import all the input files. The input file consists of protein,
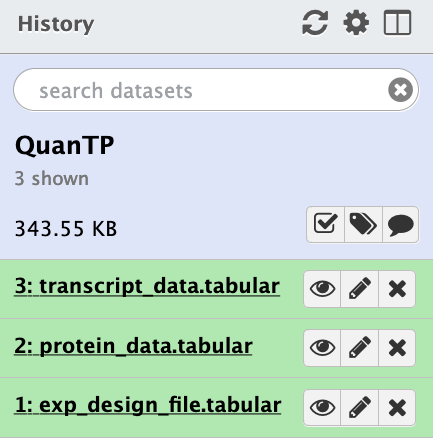
transcript abundance data and an experimental design file, all in tabular format. - Once the files have been imported, these will show up as items in our active history.
- The goal of the tool is to use the protein and transcript abundance file to create an HTML output that acts as a compilation of QuanTP’s proteo-transcriptomic quantification and correlation. To access the tool, click on the search panel on the Tool pane. Search for “QuanTP”. Or you could also find the tool in the Tool Pane under “Proteogenomics”.
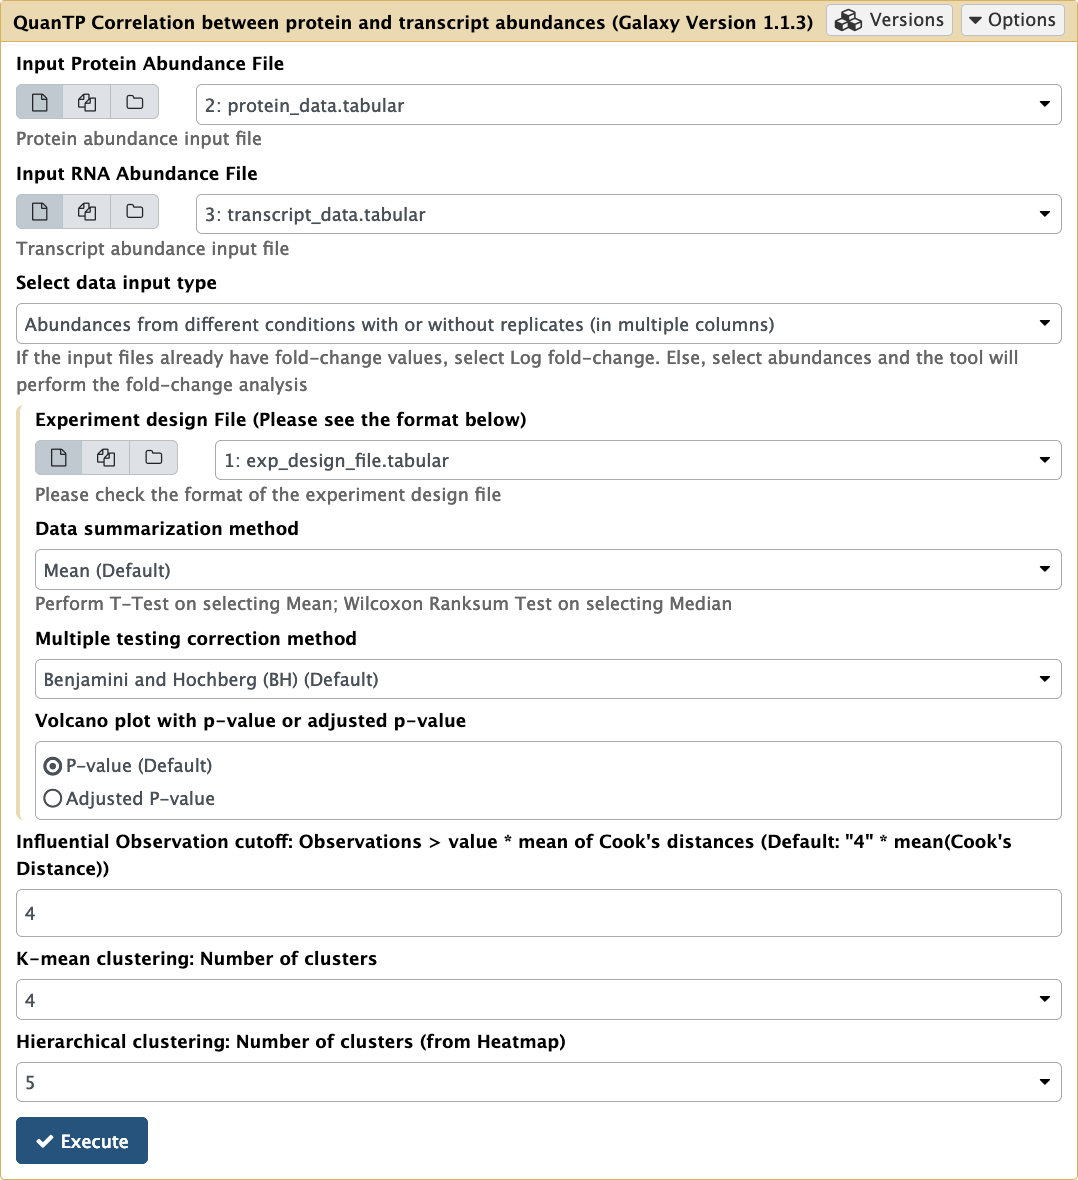
- The QuanTP tool’s interface will now show up on your Main viewing pane. To run this tool on the imported input files in the active History, the user has to make sure to select the appropriate inputs.
-
Select the inputs as shown below and then click on Execute.
- Once the tool is executed, the output will show up on the active history pane. It will be
displayed in yellow color while running and green once complete. The output of the tool is
in the HTML format. To view this output, click on the eye icon
 . To download the
output for offline viewing and sharing, click on the disk icon
. To download the
output for offline viewing and sharing, click on the disk icon  . This will
download the complete HTML output and its supporting files in an archived zip file.
. This will
download the complete HTML output and its supporting files in an archived zip file.
S1A: Instructions for enabling interactivity
-
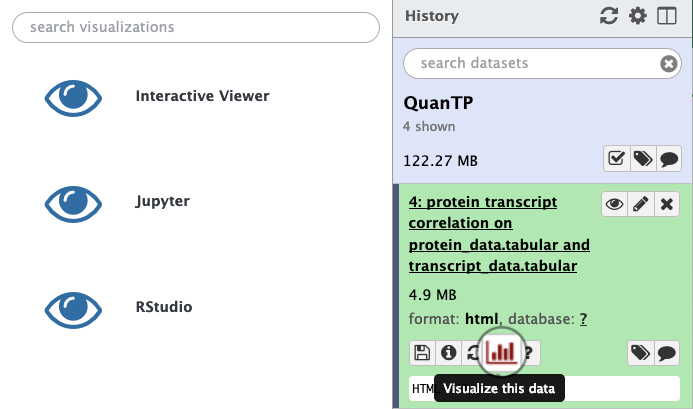
After running QuanTP (v1.1.0 or above) and obtaining an HTML file, click on that HTML file to expand the options, then select the visualization icon:

-
In the resulting pane, click “Interactive Viewer” and allow the viewer to render for a few seconds.
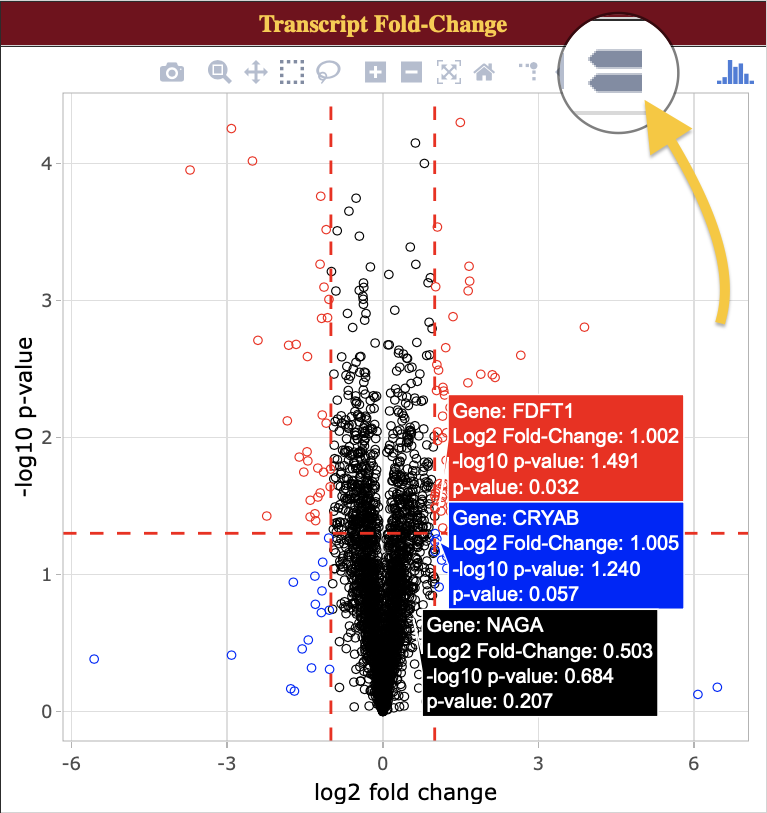
Things to try:
- Zoom in/out and pan around.
- Hover over data points to view more information about selected data.
- Activate “compare data on hover” to compare similar points:
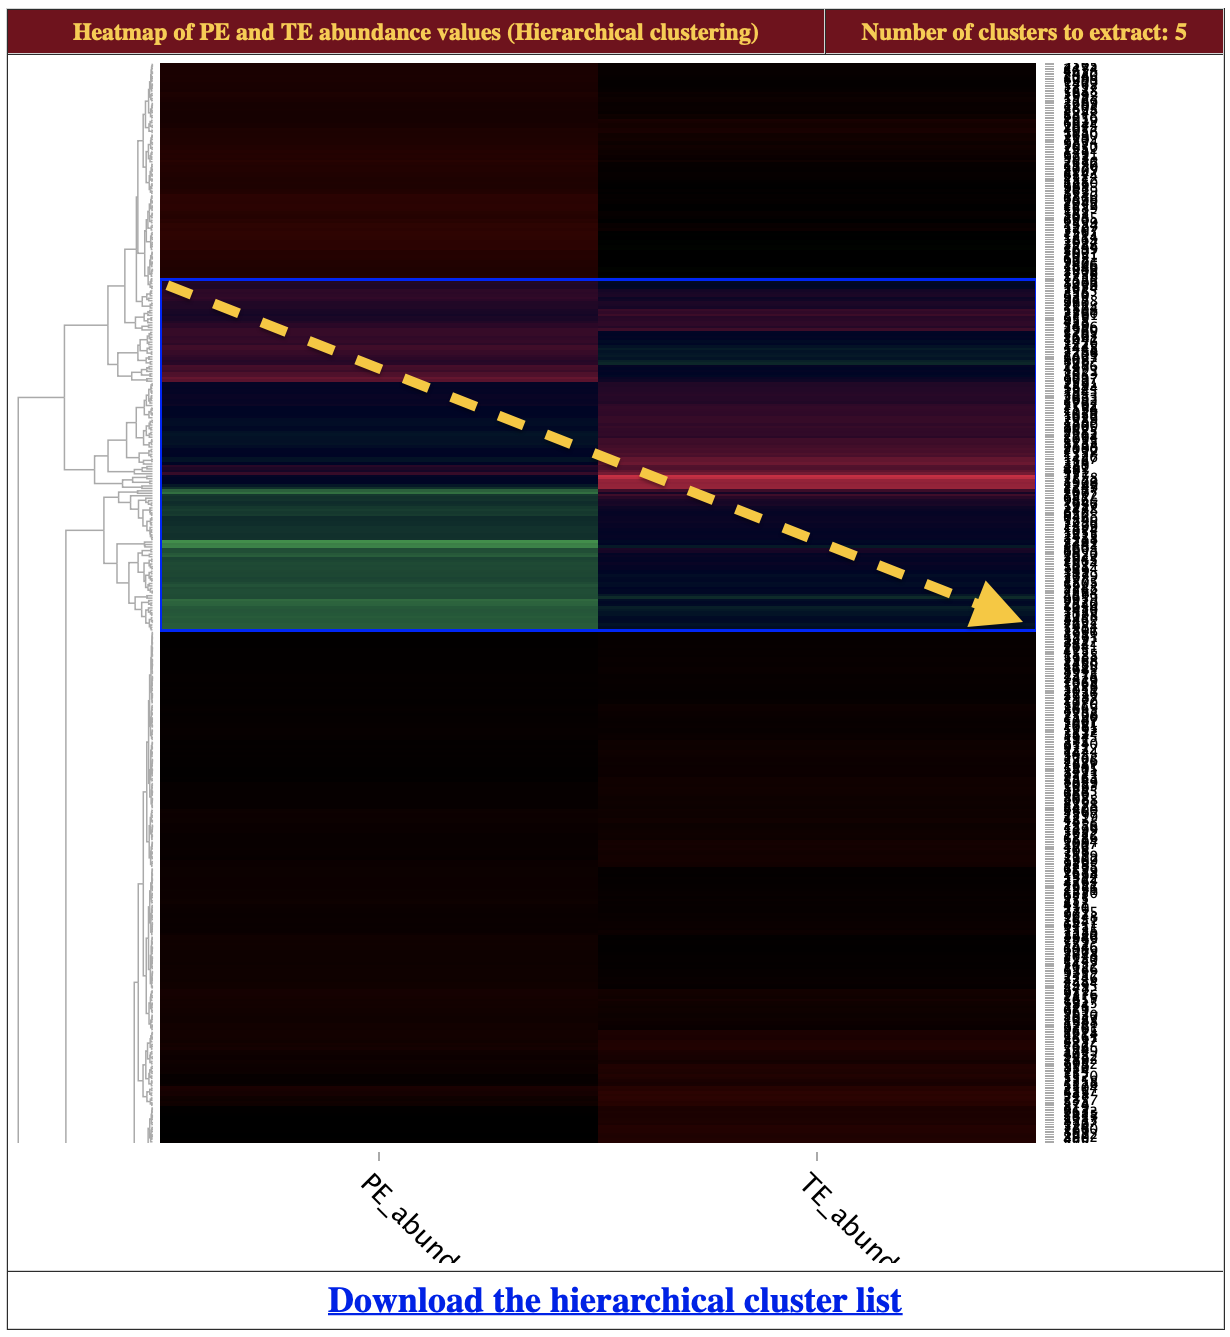
- On the heatmap, click and drag a box across a subsection to zoom in. To reset the view, double click the heatmap.
S2: Instructions for accessing and running the mouse data
(Heydarian M., Luperchio T.R., Cutler J., Mitchell C.J., Kim M.S., Pandey A., Sollner-Webb B., Reddy K. Prediction of Gene Activity in Early B Cell Development Based on an Integrative Multi-Omics Analysis. Journal of Proteomics and Bioinformatics. (2014) 7:050-063; DOI: 10.4172/jpb.1000302)
-
To access the inputs for the mouse data click on “Shared Data”→ “Data libraries”→ “QuanTP Inputs” → “QuanTP_mouse_input ”, select all files in the folder. Then, click on to import all the input files. The input file consists of protein, transcript expression data and an experimental design file, all in tabular format. For demo purposes all these datasets have been trimmed to contain only a small amount of data.
- Once the mouse files have been imported, they will show up in the active History. The history consists of two input files, a Protein_log_data.txt (protein expression data) and Transcript_log_data.txt (transcript expression data).
- To access the QuanTP tool, click on the search panel on the Tool pane (left pane). Search for “QuanTP” tool.
- The QuanTP tool’s interface will now show up on your “Main viewing pane”. To run this tool on the imported input files in the active history, the user has to make sure to select the appropriate inputs.
-
Select the below mentioned inputs and then click on “ Execute ”
- Input Protein Expression File : “Protein_log_data.txt”
- Input RNA Expression File : “Transcript_log_data.txt”
- Select data type: Log fold-change values (or single condition abundance without replicates in single column) data
- Influential Observation cutoff : “4”
- K-mean clustering: Number of clusters : “4” (default)
- Hierarchical clustering: Number of clusters (from Heatmap) : “5” (default)
- Once the tool is executed, the output will show up on the active history pane. It will be
displayed in yellow color while running and green once completed. The output of the tool
is in the HTML format. To view this output, click on the eye icon.
S3: Instructions for accessing zebrafish embryo data
(Alli Shaik, A.; Wee, S.; Li, R. H. X.; Li, Z.; Carney, T. J.; Mathavan, S.; Gunaratne, J. Functional Mapping of the Zebrafish Early Embryo Proteome and Transcriptome. J. Proteome Res. 2014 , 13 (12), 5536–5550.)
- To access the zebrafish embryo data, go to z.umn.edu/proteogenomicsgateway.
- Click on “Shared Data”→ “History”→ “QuanTP_zebrafish_embryo_data”. This will show the history with three items in it. Then, click on “Import History” to import the history.
- Dataset 1 labeled as “ protein_abundance_log10” is the tabular file containing the protein abundance whereas dataset 2 “transcript_abundance_log10” contains the transcript abundance. Dataset 3 named as “QuanTP Output on data 1 and data 2” is the HTML output generated by the QuanTP.
- To view this output, click on the eye icon.
S4: Accessing the QuanTP Docker Image
Up-to-date instructions and a Dockerfile can be accessed at z.umn.edu/quantpdocker.
- Download and install Docker (https://www.docker.com/get-started). Once installed, open it and allow it to initialize.
- Open your terminal/command prompt to interact with Docker:
- Mac: Press “⌘ + space bar”, type “terminal”
- PC: Press “Win-R”, type “cmd” and press “Enter”
- Linux: Ctrl + Alt + T
- Open your terminal/command prompt to interact with Docker:
- Install the container
- Enter this command into your terminal:
docker run -d - p 8080:80 galaxyp/quantp - The QuanTP image will be downloaded from the Docker Hub and will initialize
itself into a container. This will take a few minutes. - Once the container is initialized, the terminal will output your container’s ID and
take some time to initialize.
- Enter this command into your terminal:
- Access your initialized QuanTP Docker container at http://localhost:8080.
- Optional: Register an account by following step 2 in the first section (Instructions for accessing the QuanTP tool on Jetstream)
- Docker containers are inherently temporary, so only register if you plan on leaving the demonstration open for an extended period of time.
- To run through bovine data, follow steps 4 through 9 in the first section
(Instructions for accessing the QuanTP tool on Jetstream) - To run through mouse data, go through the second section (Supplementary for accessing and running the mouse data)
- Note: When referencing the JetStream instructions, filenames on the Docker
image may differ.
- Optional: Register an account by following step 2 in the first section (Instructions for accessing the QuanTP tool on Jetstream)
- Once finished with the Docker container, simply exit out of the Docker program to
terminate your session.- If you would like to keep Docker program running on your machine, you can terminate your container as follows:
- If you don’t know your container ID, list out the container IDs with this
command:
docker ps - Using this ID, issue this command:
docker kill [ID]
- If you don’t know your container ID, list out the container IDs with this
command:
- If you would like to keep Docker program running on your machine, you can terminate your container as follows:
S5: Accessing QuanTP on the usegalaxy.eu
- Go to https://usegalaxy.eu. This is a European Galaxy platform.
- The Galaxy instance requires that all users input an email address to access tools and
workflows. To register, perform the following steps:
- Click on the “Login or Register” tab and click on “Register”. Enter an email address, password and public name of choosing. [ NOTE: Users choosing to remain anonymous can enter an email in the form of “guest@galaxyp.org”, along with a password and public name of your choosing. Also note that this instance is solely for training purposes, and not for long-term use or testing with large datasets.]
- Once registered, click on the “User” tab and click on “Login” with your user credentials.
- Here we provide users with an integrated Galaxy tool’s interactive tour.
- Firstly, search for the QuanTP tool in the search bar located on the top left of the Tool Pane. Select the QuanTP tool. Now the interface of this tool is displayed on the center pane.
- Go to options on the right end of the center Pane and click on it. Select the “Generate Tour”
option.
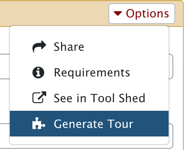
- Once you select the “Generate Tour” option. Galaxy will import the required test Data to
run the tour. The interactive tour will guide you through the steps required to run the tool.
- Select the appropriate inputs as guided by the tour and once completed, select “Execute”.
Once the tool is executed, the output will show up on the active history pane. The output of the
tool is in the HTML format. To view this output, click on the eye icon.
Supplementary Figure
Figure S1. Example input data file format
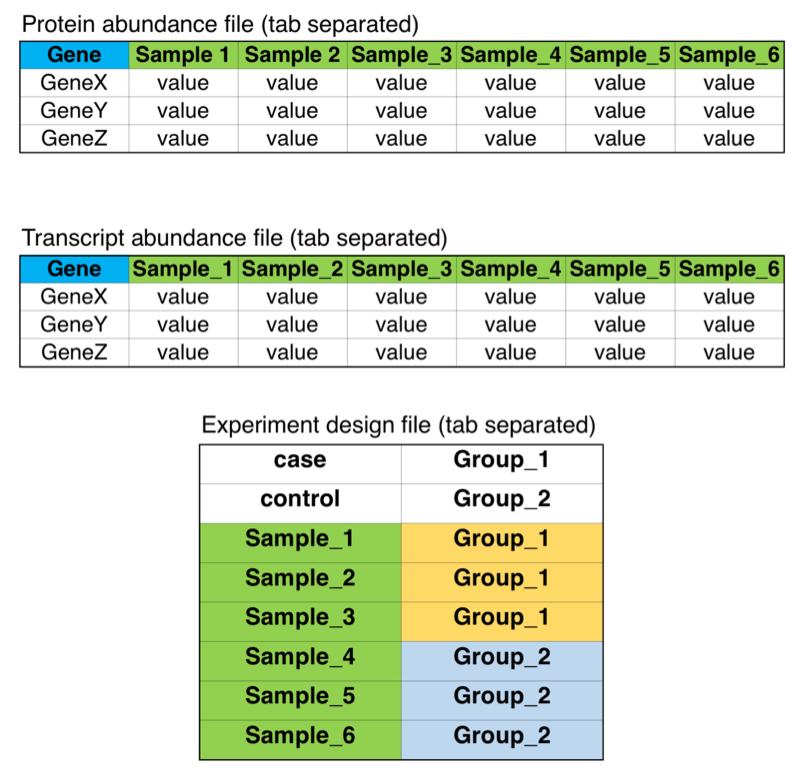
Figure S1. The three tables here describe the format of the input files to QuanTP tool, required in the “abundance mode”. The first two files should contain gene symbols and abundance values for protein or transcript. The third file, experiment design, defines the sample (column) names in the first two input files along with defining “case” and “control” groups in the first two lines.